
ExamVeda
Login
Home
This question belongs to Data Interpretation Pie Chart
Read the following information
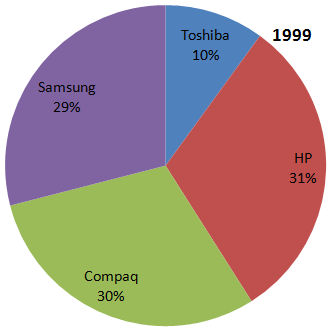
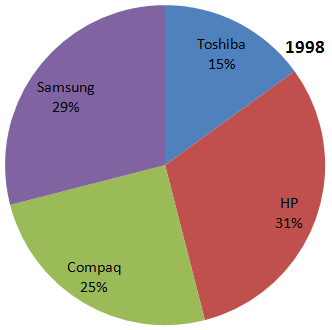
Directions (1 - 5): Based on the data given on the pie-chart. Solve the questions which follow :

Percentage Sales of different models of Computers in Kolkata in two different years . Given total sales in 1998 is 7890 and increase 16.5% in 1999.

Direction image of Pie Chart chapter
Pie Chart
?

Which brand of computers among those shown, exhibited the second highest rate of growth in two years and had less sales in 1999 than 1998?

Answer & Solution
Correct Answer: Option D
There is no percentage change in the given three company.
Thus, All of these is the correct answer.
Examveda
Question posted by Examveda
Community

Join the Discussion

4 Comments
Subrat Das
Subrat Das 3 years ago
Read question carefully before answering .
Neha Pal
Neha Pal 4 years ago
how can this be the answer D ?
Pulkit Agarwal
Pulkit Agarwal 6 years ago
How are the sales of these 3 companies lesser in 1999 as compared to 1998
S. M.
S. M. 6 years ago
should check the question and answer too