
ExamVeda
Login
Home
This question belongs to Data Interpretation Line Chart
Read the following information
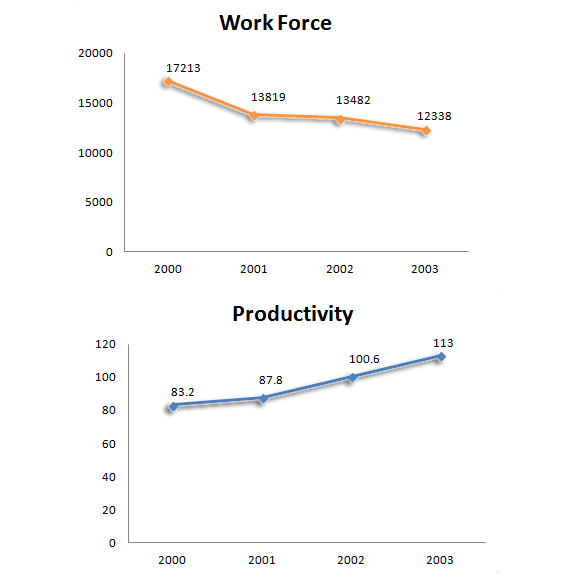
Directions (1 - 3): Answer the questions on the basis of following Line graph.

The change in Workforce and Productivity of Bajaj Auto For the Period 2000-2003
Line Chart direction image
Line Chart
?

Which two variables have mentioned in the same direction in the mentioned period?

Answer & Solution
Correct Answer: Option B
Both the Workforce and Production have dropped.
Examveda
Question posted by Examveda
Community

Join the Discussion

1 Comment
Subrat Das
Subrat Das 3 years ago
What is this ?