
?
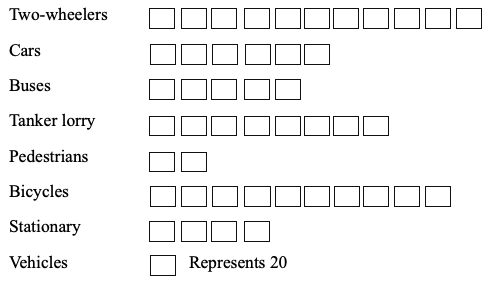
60% of the accidents are involved due to
Answer & Solution
Correct Answer:
Option
C
Two wheelers + Cars + Buses + Stationary vehicles
= 230 + 150 + 120 + 100
= 600
∴ $$\frac{600}{1000}$$ × 100 = 60%
= 230 + 150 + 120 + 100
= 600
∴ $$\frac{600}{1000}$$ × 100 = 60%

Join the Discussion
Login to post a comment or share your explanation.
Login