
?
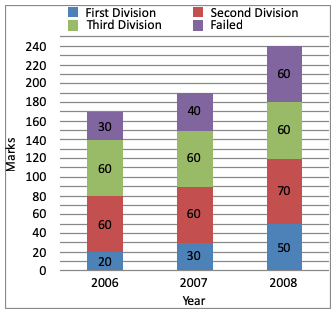
How many percent of students passed in first division in 2007?
Answer & Solution
Correct Answer:
Option
A
Total Number of students in year 2007 = 190
Students who passed in first division = 30
∴ Required percent
$$\eqalign{ & = \frac{30}{190} \times 100 \cr & = \frac{300}{19} \cr & = 15\frac{15}{19}\% \cr} $$
Students who passed in first division = 30
∴ Required percent
$$\eqalign{ & = \frac{30}{190} \times 100 \cr & = \frac{300}{19} \cr & = 15\frac{15}{19}\% \cr} $$

Join the Discussion
Login to post a comment or share your explanation.
Login