
?
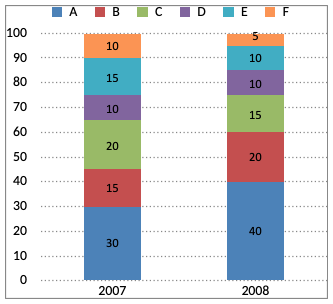
If 85% of the D type mobile produced in each year were sold by the company, how many D type mobiles remained unsold?
Answer & Solution
Correct Answer:
Option
C
'D' type production in 2007
= 35 × $$\frac{10}{100}$$
'D' type production in 2008
= 44 × $$\frac{10}{100}$$
Required Answer
$$\eqalign{ & = \left( {35 \times \frac{{10}}{{100}} + 44 \times \frac{{10}}{{100}}} \right) \times \frac{{15}}{{100}} \cr & = 118500 \cr} $$
= 35 × $$\frac{10}{100}$$
'D' type production in 2008
= 44 × $$\frac{10}{100}$$
Required Answer
$$\eqalign{ & = \left( {35 \times \frac{{10}}{{100}} + 44 \times \frac{{10}}{{100}}} \right) \times \frac{{15}}{{100}} \cr & = 118500 \cr} $$

Join the Discussion
Login to post a comment or share your explanation.
Login