
?
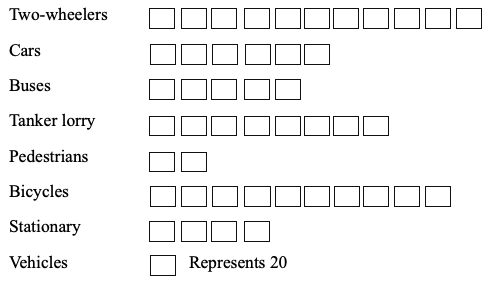
If the data of the bar diagram is represented by a pie-chart, and the angle of a sector of the pie-chart is 36°, then this sector represents the accidents involving.
Answer & Solution
Correct Answer:
Option
D
$$\eqalign{
& \therefore {360^ \circ } = 1000{\text{ Accidents}} \cr
& \,\,\,\,\,{1^ \circ } = \frac{{1000}}{{{{360}^ \circ }}} \cr
&\,\,\,\,\, {36^ \circ } = \frac{{1000}}{{{{360}^ \circ }}} \times {36^ \circ } \cr
& \,\,\,\,\,\,\,\,\,\,\,\,\, = 100{\text { Accidents}} \cr} $$
It is the accidents of Stationary vehicles
It is the accidents of Stationary vehicles

Join the Discussion
Login to post a comment or share your explanation.
Login