
?
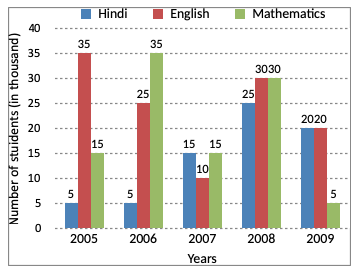
If the total number of students in the university in the year 2007 was 455030, the total number of students who opted for the given three subjects was approximately what percent of the total students?
Answer & Solution
Correct Answer:
Option
B
In 2007, we have:
Total number of students = 455030
Number of those choosing the given three subjects
= 15000 + 10000 + 15000
= 40000
∴ Required percentage
$$\eqalign{ & = \left(\frac{40000}{455030}\times100\right)\% \cr & = 8.79\% \cr & \approx 9\% \cr} $$
Total number of students = 455030
Number of those choosing the given three subjects
= 15000 + 10000 + 15000
= 40000
∴ Required percentage
$$\eqalign{ & = \left(\frac{40000}{455030}\times100\right)\% \cr & = 8.79\% \cr & \approx 9\% \cr} $$

Join the Discussion
Login to post a comment or share your explanation.
Login