
?
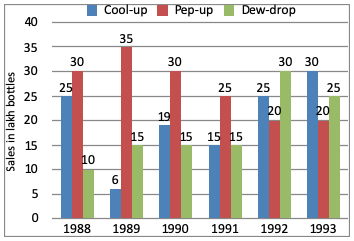
In case of which soft drink was the average annual sale minimum during the period 1988-1993?
Answer & Solution
Correct Answer:
Option
C
$$\eqalign{
& \text{Average annual sales of Dew-drop} \cr
& = \frac{10 + 15 + 15 + 15 + 30 + 25}{6} \cr
& = \frac{110}{6} \cr
& = 18.3 \text{ lakh bottles} \cr
& \text{Average sales of Cool-up} \cr
& = \frac{120}{6} \cr
& = 20 \text{ lakh bottles} \cr
& \text{So, minimum sales = Dew-drop} \cr} $$

Join the Discussion
Login to post a comment or share your explanation.
Login