
?
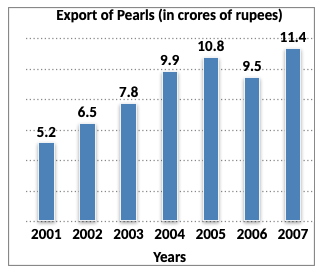
In how many years was the export above average for the given period?
Answer & Solution
Correct Answer:
Option
B
Average export during the given period = Rs. 8.73 crores.
If was above average in 2004, 2005, 2006 and 2007.
i.e. in 4 years
If was above average in 2004, 2005, 2006 and 2007.
i.e. in 4 years

Join the Discussion
Login to post a comment or share your explanation.
Login