
?
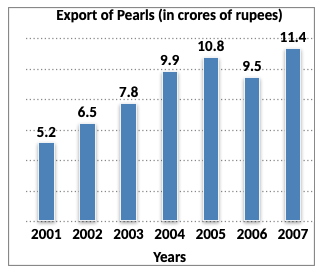
In which of the following pairs of years was the average export of pearls around Rs. 9 crores?
Answer & Solution
Correct Answer:
Option
B
$$\eqalign{
& \text{Average export in 2003 and 2004} \cr
& = \frac{7.8+9.9}{2} \text{ crores} \cr
& = \frac{17.7}{2} \text{ crores} \cr
& = \text{Rs. }8.85 \text{ crores} \cr
& \approx \text{Rs. }9 \text{ crores} \cr} $$

Join the Discussion
Login to post a comment or share your explanation.
Login