
?
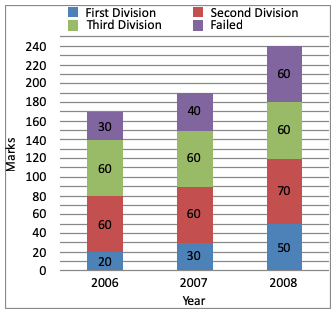
In which year, did the college have the best result for B.com?
Answer & Solution
Correct Answer:
Option
D
$$\eqalign{
& \text{Pass percentage :} \cr
& \text{Year 2006} = \frac{140}{170} × 100 = 82.35\% \cr
& \text{Year 2007} = \frac{150}{190} × 100 = 78.94\% \cr
& \text{Year 2008} = \frac{180}{240} × 100 = 75\% \cr} $$

Join the Discussion
Login to post a comment or share your explanation.
Login