
?
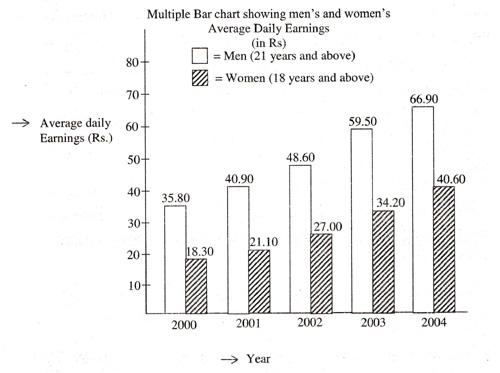
In which year is the percentage increase in the average daily earnings of men over the preceding year, the maximum ?
Answer & Solution
Correct Answer:
Option
C
$$\eqalign{
& \text{% increase in 2004,} \cr
& = \frac{66.90-59.50}{59.50}\times100 \cr
& = 12.44\% \cr
& \cr
& \text{% increase in 2003,} \cr
& = \frac{59.50-48.60}{48.60}\times100 \cr
& = 22.43\% \cr
& \cr
& \text{% increase in 2002,} \cr
& = \frac{48.60-40.90}{40.90}\times100 \cr
& = 18.83\% \cr
& \cr
& \text{% increase in 2001,} \cr
& = \frac{40.90-35.80}{35.80}\times100 \cr
& = 14.25\% \cr
& \cr} $$
Thus, maximum increase in daily earning of men over preceding year is in 2003
Thus, maximum increase in daily earning of men over preceding year is in 2003

Join the Discussion
Login to post a comment or share your explanation.
Login