
?
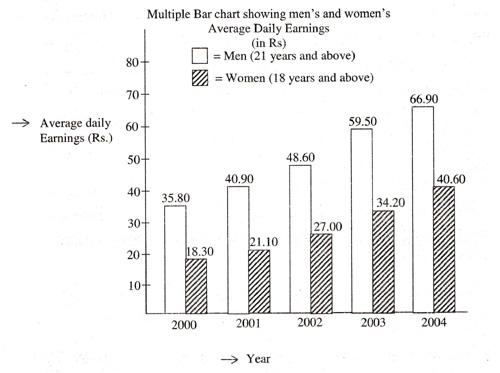
In which year is the ratio of men's average daily earnings to women's average daily earnings is the highest ?
Answer & Solution
Correct Answer:
Option
A
Required ratio in 2000,
= $$\frac{35.80}{18.30}$$
= 1.95 Required ration in 2001, = $$\frac{40.9}{21.1}$$
= 1.93 Required ration in 2002, = $$\frac{48.60}{27.0}$$
= 1.8 Required ration in 2003, = $$\frac{59.5}{34.20}$$
= 1.73 Required ration in 2004, = $$\frac{66.90}{40.60}$$
= 1.64 It is highest in 2000
= 1.95 Required ration in 2001, = $$\frac{40.9}{21.1}$$
= 1.93 Required ration in 2002, = $$\frac{48.60}{27.0}$$
= 1.8 Required ration in 2003, = $$\frac{59.5}{34.20}$$
= 1.73 Required ration in 2004, = $$\frac{66.90}{40.60}$$
= 1.64 It is highest in 2000

Join the Discussion
Login to post a comment or share your explanation.
Login