
ExamVeda
Login
Home
This question belongs to Data Interpretation Bar Chart
Read the following information
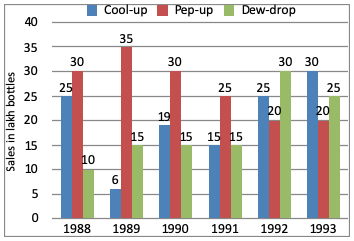
Directions(1 - 6): Study the graph and answer the questions.
Direction image of Bar Chart chapter
Bar Chart
?

In which year sale of Dew-drop is maximum?

Answer & Solution
Correct Answer: Option B
Sales of dew drop in 1992 = 30 lakh bottles
Examveda
Question posted by Examveda
Community

Join the Discussion

No comments yet Be the first to discuss this question.