
?
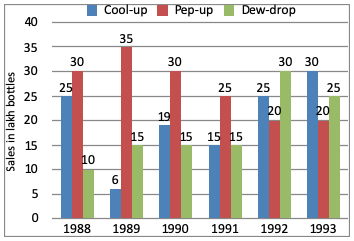
In which year the sale of cool-up is minimum?
Answer & Solution
Correct Answer:
Option
D
It is clear from the graph
Minimum sales is in 1989 = 55 lakh bottles
Minimum sales is in 1989 = 55 lakh bottles

Join the Discussion
Login to post a comment or share your explanation.
Login