
?
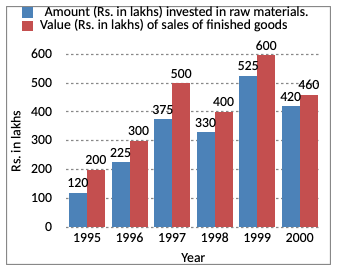
In which year, there has been a maximum percentage increase in the amount invested in raw materials as compared to the previous year?
Answer & Solution
Correct Answer:
Option
A
Percentage increase in year 1996
= $$\frac{225 - 120}{120}$$ × 100 = 87.5%
Percentage increase in year 1997
= $$\frac{375 - 225}{225}$$ × 100 = 67%
= $$\frac{225 - 120}{120}$$ × 100 = 87.5%
Percentage increase in year 1997
= $$\frac{375 - 225}{225}$$ × 100 = 67%

Join the Discussion
Login to post a comment or share your explanation.
Login