
?
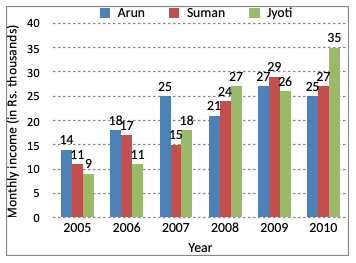
Monthly income of Suman in the year 2009 was approximately what percentage of the monthly income of Jyoti in the year 2010 ?
Answer & Solution
Correct Answer:
Option
C
Monthly income of Suman in year 2009 = Rs. 29000
Monthly income of Jyoti in year 2010 = Rs. 35000
$$\eqalign{ & = \frac{29000}{35000}\times100 \cr & = 82.85 \cr & \approx 83\% \cr} $$
Monthly income of Jyoti in year 2010 = Rs. 35000
$$\eqalign{ & = \frac{29000}{35000}\times100 \cr & = 82.85 \cr & \approx 83\% \cr} $$

Join the Discussion
Login to post a comment or share your explanation.
Login