
?
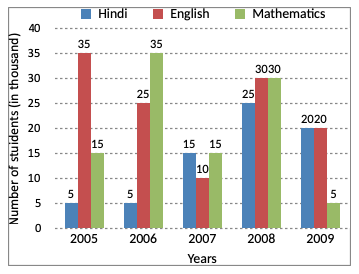
Out of the total number of students who opted for the given three subjects in the year 2009, 38% were girls. How many boys opted for Mathematics in the same year?
Answer & Solution
Correct Answer:
Option
D
Number of students who opted for the given three subjects in the year 2009 is
= 20000 + 20000 + 5000
= 45000
Number of girls = 38% of 45000
= 45000 × $$\frac{38}{100}$$
= 17100
Out of these, the number of boys who opted for Mathematics cannot be found.
= 20000 + 20000 + 5000
= 45000
Number of girls = 38% of 45000
= 45000 × $$\frac{38}{100}$$
= 17100
Out of these, the number of boys who opted for Mathematics cannot be found.

Join the Discussion
Login to post a comment or share your explanation.
Login