
?
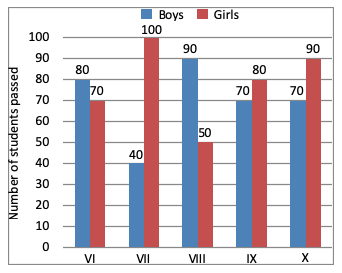
The average number of boys passed per class per class is:
Answer & Solution
Correct Answer:
Option
D
Total numbers of boys
= 80 + 40 + 90 + 70 + 70
= 350
∴ Average = $$\frac{350}{5}$$ = 70
= 80 + 40 + 90 + 70 + 70
= 350
∴ Average = $$\frac{350}{5}$$ = 70

Join the Discussion
Login to post a comment or share your explanation.
Login