
?
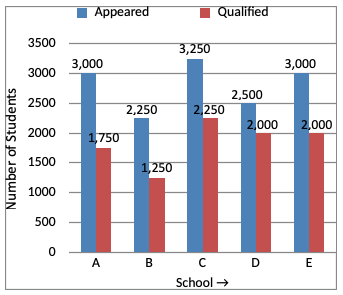
The average number of students qualified in the examination from Schools C and D is what percent of the average number of students appeared for the examination from the same school? ( round off to 2 digits after decimal).
Answer & Solution
Correct Answer:
Option
B
Average number of students qualified from C and D
$$\eqalign{ & = \frac{1}{2}\left(2250+2000\right) \cr & = \frac{4250}{2} \cr & = 2125 \cr} $$
Average number of students appeared from C and D
$$\eqalign{ & = \frac{1}{2}\left(3250+2500\right) \cr & = \frac{5750}{2} \cr & = 2875 \cr & \therefore \text{ Required %} \cr & = \left(\frac{2125}{2875}\times100\right)\% \cr & = \left(\frac{85}{115}\times100\right)\% \cr & = \frac{1700}{23}\% \cr & = 73.91\% \cr} $$
$$\eqalign{ & = \frac{1}{2}\left(2250+2000\right) \cr & = \frac{4250}{2} \cr & = 2125 \cr} $$
Average number of students appeared from C and D
$$\eqalign{ & = \frac{1}{2}\left(3250+2500\right) \cr & = \frac{5750}{2} \cr & = 2875 \cr & \therefore \text{ Required %} \cr & = \left(\frac{2125}{2875}\times100\right)\% \cr & = \left(\frac{85}{115}\times100\right)\% \cr & = \frac{1700}{23}\% \cr & = 73.91\% \cr} $$

Join the Discussion
Login to post a comment or share your explanation.
Login