
?
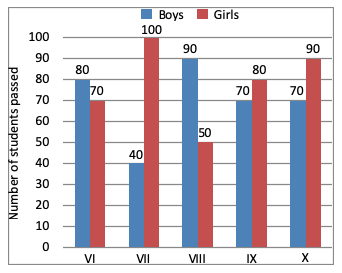
The class having the highest number of passed students, is:
Answer & Solution
Correct Answer:
Option
D
Class VI = 80 + 70 = 150
Class VII = 100 + 40 = 140
Class VIII = 90 + 50 = 140
Class IX = 80 + 70 = 150
Class X = 90 + 70 = 160 (highest)
Class X is highest number of students passed.
Class VII = 100 + 40 = 140
Class VIII = 90 + 50 = 140
Class IX = 80 + 70 = 150
Class X = 90 + 70 = 160 (highest)
Class X is highest number of students passed.

Join the Discussion
Login to post a comment or share your explanation.
Login