
?
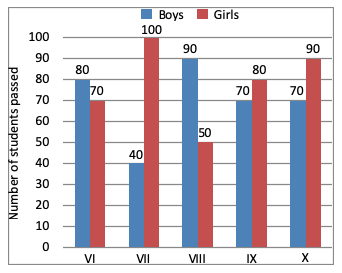
The class in which the number of boys passed is nearest to the average number of girls passed per class, is-
Answer & Solution
Correct Answer:
Option
D
$$\eqalign{
& \text{Average no. of girls} \cr
& = \frac{70 + 100 + 50 + 80 + 90}{5} \cr
& = \frac{390}{5} \cr
& = 78 \cr} $$
Class VI boys is nearest to the average no. of girls passed per class.
Class VI boys is nearest to the average no. of girls passed per class.

Join the Discussion
Login to post a comment or share your explanation.
Login