
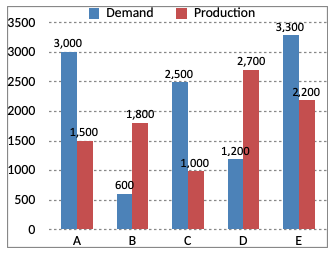
?
The difference between average demand and average production of the five companies taken together is-
Answer & Solution
Correct Answer:
Option
B
Total production of the five companies
= 1500 + 1800 +1000 + 2700 + 2200
= 9200
Total demand of the five companies
= 3000 + 600 + 2500 + 1200 + 3300
= 10600
∴ Required difference
$$\eqalign{ & = \frac{1}{5}\left(10600-9200\right) \cr & = \frac{1}{5}\times1400 \cr & = 280 \cr} $$
= 1500 + 1800 +1000 + 2700 + 2200
= 9200
Total demand of the five companies
= 3000 + 600 + 2500 + 1200 + 3300
= 10600
∴ Required difference
$$\eqalign{ & = \frac{1}{5}\left(10600-9200\right) \cr & = \frac{1}{5}\times1400 \cr & = 280 \cr} $$

Join the Discussion
Login to post a comment or share your explanation.
Login