
?
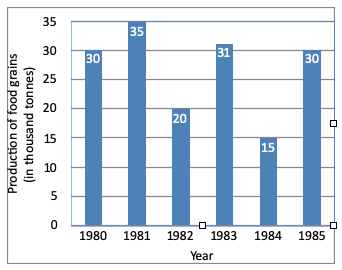
The difference of the production of food grains for the year 1981 and 1985 is:
Answer & Solution
Correct Answer:
Option
C
Difference of production of 1981 and 1985
= 35 - 30
= 5 × 1000
= 5000 tonnes
= 35 - 30
= 5 × 1000
= 5000 tonnes

Join the Discussion
Login to post a comment or share your explanation.
Login