
ExamVeda
Login
Home
This question belongs to Data Interpretation Bar Chart
Read the following information
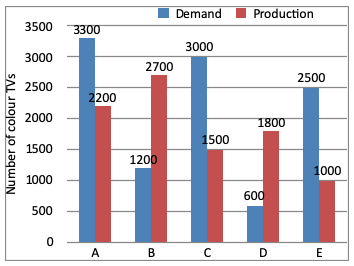
Directions(1 - 4): Study the bar diagram and answer the following questions.
Demand and production of colour TV of five companies A, B, C, D, and E.
Direction image of Bar Chart chapter
Bar Chart
?

The percentage of the demand of company D as compared to the demand of company E is:

Answer & Solution
Correct Answer: Option B
$$\eqalign{ & \text{Required percentage} \cr & = \frac{600}{2500} \times 100 \cr & = 24\% \cr} $$
Examveda
Question posted by Examveda
Community

Join the Discussion

No comments yet Be the first to discuss this question.