
?
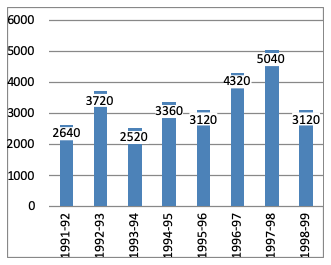
The ratio of number of years, in which the foreign exchange reserves are above the average reserves, to those in which the reserves are below the average reserves is:
Answer & Solution
Correct Answer:
Option
C
Average reserves
$$= \frac{2640+3720+2520+3360+3120+4320+5040+3120}{8}$$
$$\eqalign{ & = \frac{27840}{8} \cr & = 3480 \cr & \text{So, required ratio }=3:5 \cr} $$
Note :
Years in which the foreign exchange reserves are above the average reserves = 1992-93, 1996-97, 1997-98 = 3 years
Years in which the foreign exchange reserves are below the average reserves = 1991-92, 1993-94, 1994-95, 1995-1996, 1998-1999 = 5 years
$$= \frac{2640+3720+2520+3360+3120+4320+5040+3120}{8}$$
$$\eqalign{ & = \frac{27840}{8} \cr & = 3480 \cr & \text{So, required ratio }=3:5 \cr} $$
Note :
Years in which the foreign exchange reserves are above the average reserves = 1992-93, 1996-97, 1997-98 = 3 years
Years in which the foreign exchange reserves are below the average reserves = 1991-92, 1993-94, 1994-95, 1995-1996, 1998-1999 = 5 years

Join the Discussion
Login to post a comment or share your explanation.
Login