
?
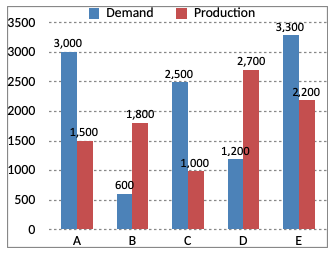
The ratio of the number of companies having more demand to those having more production than demand is -
Answer & Solution
Correct Answer:
Option
C
Number of companies having more demand than production = 3
Number of companies having more production than demand = 2
∴ Required ratio
= 3 : 2
Number of companies having more production than demand = 2
∴ Required ratio
= 3 : 2

Join the Discussion
Login to post a comment or share your explanation.
Login