
?
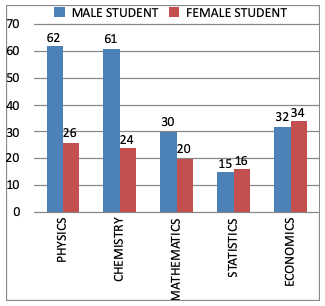
The total number of male students who got admitted in mathematics and economics as compared to the total number of female students getting admission in mathematics and economics is:
Answer & Solution
Correct Answer:
Option
C
Total number of male students in Mathematics and Economics
= 30 + 32
= 62
Total number of female students in Mathematics & Economics
= 20 + 34
= 54
∴ Required %
$$\eqalign{ & = \frac{62 - 54}{54} \times 100 \cr & = \frac{8}{54} \times 100 \cr & = \frac{400}{27}\% \cr & = 14.8\% \text{ more} \cr} $$
= 30 + 32
= 62
Total number of female students in Mathematics & Economics
= 20 + 34
= 54
∴ Required %
$$\eqalign{ & = \frac{62 - 54}{54} \times 100 \cr & = \frac{8}{54} \times 100 \cr & = \frac{400}{27}\% \cr & = 14.8\% \text{ more} \cr} $$

Join the Discussion
Login to post a comment or share your explanation.
Login