
?
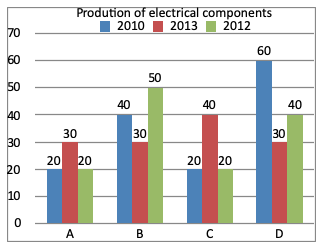
The total production of companies A and D in year 2010 is what percent of total production of four companies in the year 2012?
Answer & Solution
Correct Answer:
Option
D
In 2010, A and D
= 20 + 60
= 80
In 2012, A + B + C + D
= 20 + 50 + 20 + 40
= 130
= $$\frac{80}{130}$$ × 100
≈ 61%
= 20 + 60
= 80
In 2012, A + B + C + D
= 20 + 50 + 20 + 40
= 130
= $$\frac{80}{130}$$ × 100
≈ 61%

Join the Discussion
Login to post a comment or share your explanation.
Login