
ExamVeda
Login
Home
This question belongs to Data Interpretation Bar Chart
Read the following information
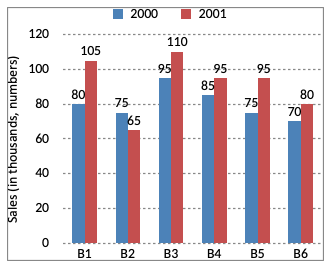
Directions (1 - 5): The bar graph given below shows the sales of books (in thousand numbers from six branches of a publishing company during two consecutive years 2000 and 2001. Sales of books (in thousands numbers) from six branches B1, B2, B3, B4, B5 and B6 of a publishing company in 2000 and 2001.
Direction image of Bar Chart chapter
Bar Chart
?

Total sales branches B1, B3 and B5 together for both the years (in thousands number) is?

Answer & Solution
Correct Answer: Option C
Total sales of branches B1, B3 and B5 for both the years (in thousands numbers)
= (80 + 105) + (95 + 110) + (75 + 95)
= 560
Examveda
Question posted by Examveda
Community

Join the Discussion

No comments yet Be the first to discuss this question.