
?
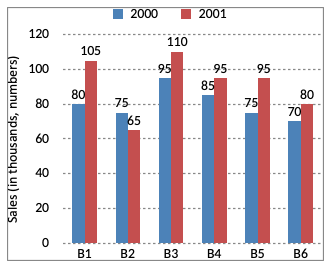
What is the average sales of all the branches (in thousands numbers) for the years 2000?
Answer & Solution
Correct Answer:
Option
B
Total sales of all the six branches (in thousand numbers) for the year 2000
= 80 + 75 + 95 + 85 + 75 + 70
= 480
Average sales of all the six branches (in thousand numbers) for the year 2000
$$\eqalign{ & = \frac{480}{6} \cr & = 80 \cr} $$
= 80 + 75 + 95 + 85 + 75 + 70
= 480
Average sales of all the six branches (in thousand numbers) for the year 2000
$$\eqalign{ & = \frac{480}{6} \cr & = 80 \cr} $$

Join the Discussion
Login to post a comment or share your explanation.
Login