
?
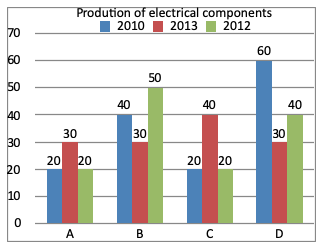
What is the ratio between average production by company B in three years to the average production by company C in three years?
Answer & Solution
Correct Answer:
Option
C
$$\eqalign{
& \text{B} = \frac{40 + 30 + 50}{3} = \frac{120}{3} = 40 \cr
& \text{C} = \frac{20 + 40 + 20}{3} = \frac{80}{3} \cr
& \text{then B : C} = 40 : \frac{80}{3} \cr
& \,\,\,\,\,\,\,\,\, \text{B : C} = 3 : 2 \cr} $$

Join the Discussion
Login to post a comment or share your explanation.
Login