
?
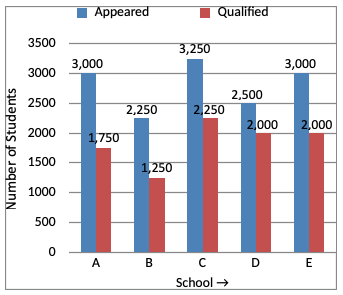
What is the ratio of the number of students qualified in the scholarship examination from School A and the number of students qualified in the examination from School B?
Answer & Solution
Correct Answer:
Option
D
(Number of students qualified from A) : (Number of students qualified from B)
$$\eqalign{ & = \frac{1750}{1250} \cr & = \frac{7}{5} \cr & = 7:5 \cr} $$
$$\eqalign{ & = \frac{1750}{1250} \cr & = \frac{7}{5} \cr & = 7:5 \cr} $$

Join the Discussion
Login to post a comment or share your explanation.
Login