
?
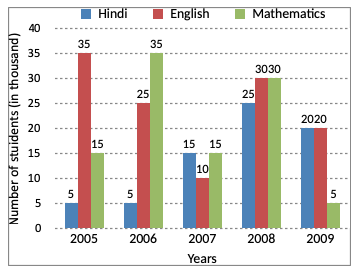
What is the ratio of the number of students who opted for English in the years 2006 and 2008 together to the number of students who opted for Hindi in the years 2005 and 2009 together?
Answer & Solution
Correct Answer:
Option
A
Ratio of the number who opted for English in 2006 and 2008 to the number who opted for Hindi in 2005 and 2009
= (25 + 30) : (5 + 20)
= 55 : 25
= 11 : 5
= (25 + 30) : (5 + 20)
= 55 : 25
= 11 : 5

Join the Discussion
Login to post a comment or share your explanation.
Login