
?
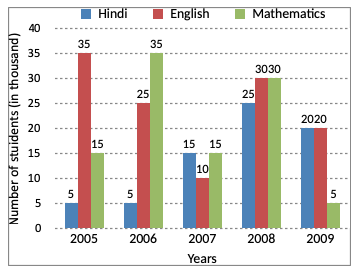
What is the total number of students who opted for Hindi and Mathematics in the years 2006, 2007 and 2009 together?
Answer & Solution
Correct Answer:
Option
E
Number of students who opted Hindi and Mathematics in 2006, 2007 and 2009
= {(5 + 35) + (15 + 15) + (20 + 5)} thousands
= 95000
= {(5 + 35) + (15 + 15) + (20 + 5)} thousands
= 95000

Join the Discussion
Login to post a comment or share your explanation.
Login