
?
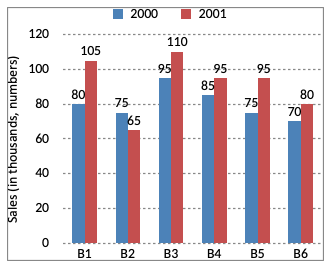
What percent of the average sales branches B1, B2 and B3 in 2001 is the average sales of branches B1, B3 and B6 in 2000?
Answer & Solution
Correct Answer:
Option
D
Total sales (in thousand numbers) of branches B1, B3 and B6 in 2000
= 80 + 95 + 70
= 245
Average sales (in thousands number) of branches B1, B3 and B6 in 2000
= $$\frac{245}{3}$$
Total sales (in thousands number) of branches B1, B2 and B3 in 2001
= 105 + 65 + 110
= 280
Average sales (in thousand number) of branches B1, B2 and B3 in 2001
$$\eqalign{ & = \frac{280}{3} \cr & \text{So,Required percentage} \cr & = \frac{\frac{245}{3}}{\frac{280}{3}}\times100\% \cr & = \frac{245}{280}\times100 \cr & = 87.5\% \cr} $$
= 80 + 95 + 70
= 245
Average sales (in thousands number) of branches B1, B3 and B6 in 2000
= $$\frac{245}{3}$$
Total sales (in thousands number) of branches B1, B2 and B3 in 2001
= 105 + 65 + 110
= 280
Average sales (in thousand number) of branches B1, B2 and B3 in 2001
$$\eqalign{ & = \frac{280}{3} \cr & \text{So,Required percentage} \cr & = \frac{\frac{245}{3}}{\frac{280}{3}}\times100\% \cr & = \frac{245}{280}\times100 \cr & = 87.5\% \cr} $$

Join the Discussion
Login to post a comment or share your explanation.
Login