
?
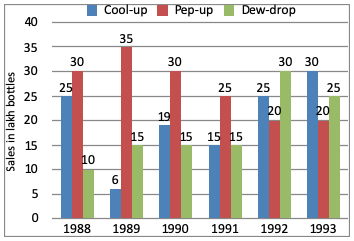
What was the approximate percent increase in sales of cool-up in 1990 over its sales in 1989?
Answer & Solution
Correct Answer:
Option
C
Sales of cool up in 1989 = 6 lakh bottles
Sales of cool up in 1990 = 19 lakh bottles
∴ Required percent
$$\eqalign{ & = \frac{19 - 6}{6} \times 100 \cr & = \frac{13}{6} \times 100 \cr & = 216\% \cr} $$
Sales of cool up in 1990 = 19 lakh bottles
∴ Required percent
$$\eqalign{ & = \frac{19 - 6}{6} \times 100 \cr & = \frac{13}{6} \times 100 \cr & = 216\% \cr} $$

Join the Discussion
Login to post a comment or share your explanation.
Login