
ExamVeda
Login
Home
This question belongs to Data Interpretation Bar Chart
Read the following information
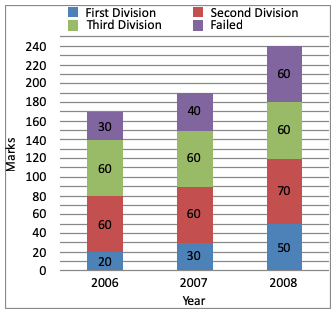
Directions (1 - 4): The subdivided bar diagram given below depicts the result of B.com students of a college for 3 years. Study the graph and answer the given questions.
Direction image of Bar Chart chapter
Bar Chart
?

What was the number of third division in 2006?

Answer & Solution
Correct Answer: Option A
Students who passed in third division in 2006
= 140 - 80
= 60
Examveda
Question posted by Examveda
Community

Join the Discussion

No comments yet Be the first to discuss this question.