
ExamVeda
Login
Home
This question belongs to Data Interpretation Bar Chart
Read the following information
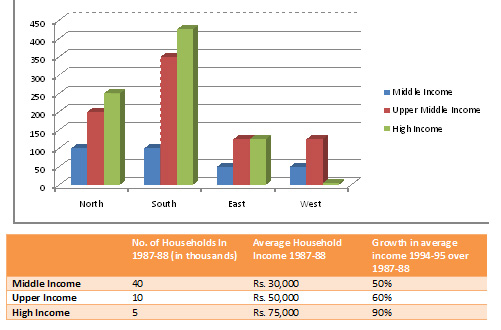
Directions (1 - 4) The following bar chart gives the growth percentage in the number of households in middle, upper-middle and high-income categories in the four regions for the period between 1987-88 and 1994-95.
Bar Chart direction image
Bar Chart
?

What was the total household income in northern region for upper-middle class ?

Answer & Solution
Correct Answer: Option D
Region wise breakup is not available. hence, question cannot be answered.
Examveda
Question posted by Examveda
Community

Join the Discussion

No comments yet Be the first to discuss this question.