
ExamVeda
Login
Home
This question belongs to Data Interpretation Bar Chart
Read the following information
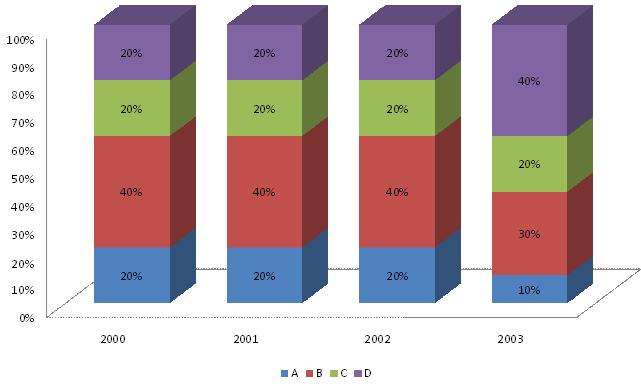
Directions (1 - 5): The cumulative bar chart below gives us the production of four Products A, B, C and D for four years. It is known that the total production increases @20% over its value in the previous year. The difference between C's production in 2003 and A's production in 2001 is 2640 units.

Production of A, B, C and D.
Bar Chart  direction image
Bar Chart
?

Which of the following is Not true?

Answer & Solution
Correct Answer: Option C
Statement C is not true, since both A and B have not shown an increasing trend.
Examveda
Question posted by Examveda
Community

Join the Discussion

No comments yet Be the first to discuss this question.