ExamVeda
Login
Home
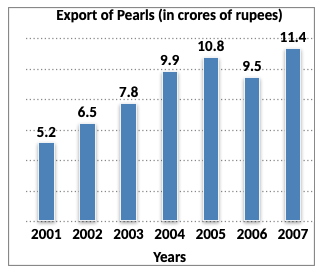
Directions (1 - 5): Study the following bar-graph carefully and answer the questions given below:
Direction image of Bar Chart chapter
1
In how many years was the export above average for the given period?
Discuss
Answer & Solution
Average export during the given period = Rs. 8.73 crores.
If was above average in 2004, 2005, 2006 and 2007.
i.e. in 4 years
2
What was the percentage increase in export from 2006 to 2007 ?
Discuss
Answer & Solution
Percentage increase in export from 2006 to 2007.
$$\eqalign{ & = \left(\frac{11.4-9.5}{9.5}\times100\right)\% \cr & = \left(\frac{1.9}{9.5}\times100\right)\% \cr & = \left(\frac{19}{95}\times100\right)\% \cr & = 20\% \cr} $$
3
The average export of pearls for the given period (in Rs. crores) was ?
Discuss
Answer & Solution
Average export of pearls over the period
  $$ = \left\{\frac{1}{7}\left(5.2+6.5+7.8+9.9+10.8+9.5+11.4\right)\right\}\text{crores}$$
$$\eqalign{ & = \frac{61.1}{7}\text{ crores} \cr & = 8.728 \text{ crores} \cr & = \text{Rs. }8.73 \text{ crores} \cr} $$
4
In which of the following pairs of years was the average export of pearls around Rs. 9 crores?
Discuss
Answer & Solution
$$\eqalign{ & \text{Average export in 2003 and 2004} \cr & = \frac{7.8+9.9}{2} \text{ crores} \cr & = \frac{17.7}{2} \text{ crores} \cr & = \text{Rs. }8.85 \text{ crores} \cr & \approx \text{Rs. }9 \text{ crores} \cr} $$
5
In which year was there maximum percentage increase in export of pearls to that in the previous year?
Discuss
Answer & Solution
$$\eqalign{ & \text{Increase % in various years} \cr & 2002 → \left\{\frac{\left(6.5-5.2\right)}{5.2}\times100\right\}\% \cr & \,\,\,\,\,\,\,\,\,\,\,\,\, = \left(\frac{1.3}{5.2}\times100\right)\% \cr & \,\,\,\,\,\,\,\,\,\,\,\,\, = \left(\frac{13}{52}\times100\right)\% \cr & \,\,\,\,\,\,\,\,\,\,\,\,\, = 25\% \cr \cr & 2003 → \left\{\frac{\left(7.8-6.5\right)}{6.5}\times100\right\}\% \cr & \,\,\,\,\,\,\,\,\,\,\,\,\, = \left(\frac{1.3}{6.5}\times100\right)\% \cr & \,\,\,\,\,\,\,\,\,\,\,\,\, = \left(\frac{13}{65}\times100\right)\% \cr & \,\,\,\,\,\,\,\,\,\,\,\,\, = 20\% \cr \cr & 2004 → \left\{\frac{\left(9.9-7.8\right)}{7.8}\times100\right\}\% \cr & \,\,\,\,\,\,\,\,\,\,\,\,\, = \left(\frac{2.1}{7.8}\times100\right)\% \cr & \,\,\,\,\,\,\,\,\,\,\,\,\, = \left(\frac{21}{78}\times100\right)\% \cr & \,\,\,\,\,\,\,\,\,\,\,\,\, = 26.9\% \cr \cr & 2005 → \left\{\frac{\left(10.8-9.9\right)}{9.9}\times100\right\}\% \cr & \,\,\,\,\,\,\,\,\,\,\,\,\, = \left(\frac{0.9}{9.9}\times100\right)\% \cr & \,\,\,\,\,\,\,\,\,\,\,\,\, = \left(\frac{9}{99}\times100\right)\% \cr & \,\,\,\,\,\,\,\,\,\,\,\,\, = \frac{100}{11}\% \cr & \,\,\,\,\,\,\,\,\,\,\,\,\, = 9.090\% \cr \cr & 2007 → \left\{\frac{\left(11.4-9.5\right)}{9.5}\times100\right\}\% \cr & \,\,\,\,\,\,\,\,\,\,\,\,\, = \left(\frac{1.9}{9.5}\times100\right)\% \cr & \,\,\,\,\,\,\,\,\,\,\,\,\, = \left(\frac{19}{95}\times100\right)\% \cr & \,\,\,\,\,\,\,\,\,\,\,\,\, = 20\% \cr & \cr } $$
Clearly, the maximum increase was in 2004