
ExamVeda
Login
Home
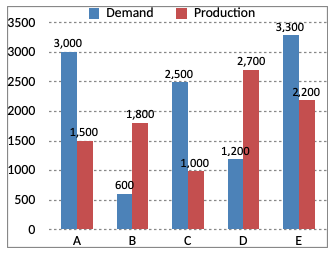
Directions (1 - 5): The following chart represents Demand and Production for 5 companies ABCDE. On the basis of the graph answer the questions.
Direction image of Bar Chart chapter
1
If the production of company D is h times of the production of company A. Then h equals:
Discuss
Answer & Solution
Production of company D = 2700
Production of company A = 1500
$$\eqalign{ & h = \frac{\text{Production of company D}}{\text{Production of company A}} \cr & h = \frac{2700}{1500} \cr & h = \frac{9}{5} \cr & h = 1.8 \cr} $$
2
The ratio of the number of companies having more demand to those having more production than demand is -
Discuss
Answer & Solution
Number of companies having more demand than production = 3
Number of companies having more production than demand = 2
∴ Required ratio
= 3 : 2
3
If company A desires to meet the demand by purchasing surplus production of company, then the most suitable company is -
Discuss
Answer & Solution
Difference between demand and production of company A
= 3000 - 1500
= 1500
Difference between production and demand of company D
= 2700 - 1200
= 1500
4
The difference between average demand and average production of the five companies taken together is-
Discuss
Answer & Solution
Total production of the five companies
= 1500 + 1800 +1000 + 2700 + 2200
= 9200
Total demand of the five companies
= 3000 + 600 + 2500 + 1200 + 3300
= 10600
∴ Required difference
$$\eqalign{ & = \frac{1}{5}\left(10600-9200\right) \cr & = \frac{1}{5}\times1400 \cr & = 280 \cr} $$
5
If x% of demand for company C equals demand for company B, then x equals.
Discuss
Answer & Solution
Given $$x$$% of demand for company C = Demand for company B
$$\eqalign{ & \Rightarrow \frac{2500\times x}{100} = 600 \cr & \Rightarrow 25x = 600 \cr & \Rightarrow x = \frac{600}{25} \cr & \Rightarrow x = 24 \cr} $$