
ExamVeda
Login
Home
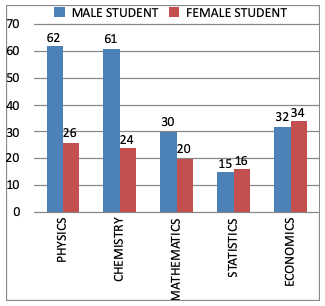
Directions (1 - 4): The data given in bar diagram relate to the department wise admission of 320 students to B Sc. (Honors) first year classes of a certain college in the given five subjects. Study the graph and answer the questions.
Direction image of Bar Chart chapter
1
The subject in which the difference in the number of male and female students is minimum in:
Discuss
Answer & Solution
Statistics (1), It is clear from graph.
2
The total number of male students who got admitted in mathematics and economics as compared to the total number of female students getting admission in mathematics and economics is:
Discuss
Answer & Solution
Total number of male students in Mathematics and Economics
= 30 + 32
= 62
Total number of female students in Mathematics & Economics
= 20 + 34
= 54
∴ Required %
$$\eqalign{ & = \frac{62 - 54}{54} \times 100 \cr & = \frac{8}{54} \times 100 \cr & = \frac{400}{27}\% \cr & = 14.8\% \text{ more} \cr} $$
3
The difference of the choice of the subject between male and female students is maximum for the subject.
Discuss
Answer & Solution
Chemistry (37), It is clear from graph.
4
The subject which the female student are finding difficult as compared to other subject is:
Discuss
Answer & Solution
If is clear from graph
Maximum number of female students is difficulty in Statistics.