
ExamVeda
Login
Home
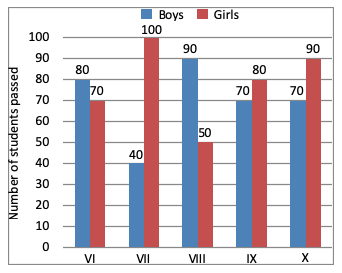
Directions (1 - 4): The bar graph shows the results of an annual examination in a secondary school in a certain year. Answer the following four questions based on this chart.
Direction image of Bar Chart chapter
1
The ratio of the total number of boys passed to the total number of girls passed in the three classes VII, VIII and IX is:
Discuss
Answer & Solution
$$\eqalign{ & \text{Required ratio} \cr & = \frac{40 + 90 + 70}{100 + 50 + 80} \cr & = \frac{200}{230} \cr & = \frac{20}{23} \cr & = 20 : 23 \cr} $$
2
The average number of boys passed per class per class is:
Discuss
Answer & Solution
Total numbers of boys
= 80 + 40 + 90 + 70 + 70
= 350
∴ Average = $$\frac{350}{5}$$ = 70
3
The class in which the number of boys passed is nearest to the average number of girls passed per class, is-
Discuss
Answer & Solution
$$\eqalign{ & \text{Average no. of girls} \cr & = \frac{70 + 100 + 50 + 80 + 90}{5} \cr & = \frac{390}{5} \cr & = 78 \cr} $$
Class VI boys is nearest to the average no. of girls passed per class.
4
The class having the highest number of passed students, is:
Discuss
Answer & Solution
Class VI = 80 + 70 = 150
Class VII = 100 + 40 = 140
Class VIII = 90 + 50 = 140
Class IX = 80 + 70 = 150
Class X = 90 + 70 = 160 (highest)
Class X is highest number of students passed.