
ExamVeda
Login
Home
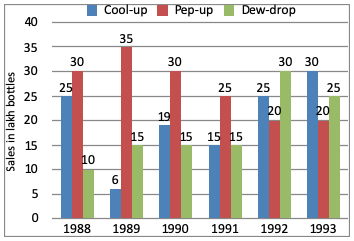
Directions(1 - 6): Study the graph and answer the questions.
Direction image of Bar Chart chapter
1
What was the approximate percent drop in the sales of pep-up in 1990 over its sale in 1989?
Discuss
Answer & Solution
Sales of pep up:
Year 1989 = 35 lakh bottles
Year 1990 = 30 lakh bottles
∴ Required percent
$$\eqalign{ & = \frac{35 - 30}{35} \times 100 \cr & = \frac{100}{7} \cr & = 14.28 \approx 14 \cr} $$
2
In case of which soft drink was the average annual sale minimum during the period 1988-1993?
Discuss
Answer & Solution
$$\eqalign{ & \text{Average annual sales of Dew-drop} \cr & = \frac{10 + 15 + 15 + 15 + 30 + 25}{6} \cr & = \frac{110}{6} \cr & = 18.3 \text{ lakh bottles} \cr & \text{Average sales of Cool-up} \cr & = \frac{120}{6} \cr & = 20 \text{ lakh bottles} \cr & \text{So, minimum sales = Dew-drop} \cr} $$
3
In which year the sale of cool-up is minimum?
Discuss
Answer & Solution
It is clear from the graph
Minimum sales is in 1989 = 55 lakh bottles
4
What was the approximate percent increase in sales of cool-up in 1990 over its sales in 1989?
Discuss
Answer & Solution
Sales of cool up in 1989 = 6 lakh bottles
Sales of cool up in 1990 = 19 lakh bottles
∴ Required percent
$$\eqalign{ & = \frac{19 - 6}{6} \times 100 \cr & = \frac{13}{6} \times 100 \cr & = 216\% \cr} $$
5
In case of which soft drink was the average annual sale maximum during the period 1988-1993?
Discuss
Answer & Solution
Average annual sales during 1988 - 1993
  Cool up
$$\eqalign{ & = \frac{25 + 6 + 19 + 15 + 25 + 30}{6} \cr & = \frac{120}{6} \cr & = 20 \text{ lakh bottles} \cr & \text{Pep up} \cr & = \frac{30 + 35 + 30 + 25 + 20 + 20}{6} \cr & = \frac{160}{6} \cr & = 26\frac{2}{3} \text{ lakh bottles} \cr} $$
6
In which year sale of Dew-drop is maximum?
Discuss
Answer & Solution
Sales of dew drop in 1992 = 30 lakh bottles