
ExamVeda
Login
Home
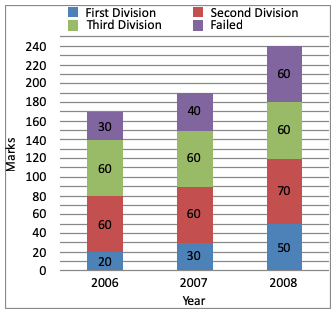
Directions (1 - 4): The subdivided bar diagram given below depicts the result of B.com students of a college for 3 years. Study the graph and answer the given questions.
Direction image of Bar Chart chapter
1
What was the number of third division in 2006?
Discuss
Answer & Solution
Students who passed in third division in 2006
= 140 - 80
= 60
2
How many percent of students passed in first division in 2007?
Discuss
Answer & Solution
Total Number of students in year 2007 = 190
Students who passed in first division = 30
∴ Required percent
$$\eqalign{ & = \frac{30}{190} \times 100 \cr & = \frac{300}{19} \cr & = 15\frac{15}{19}\% \cr} $$
3
In which year, did the college have the best result for B.com?
Discuss
Answer & Solution
$$\eqalign{ & \text{Pass percentage :} \cr & \text{Year 2006} = \frac{140}{170} × 100 = 82.35\% \cr & \text{Year 2007} = \frac{150}{190} × 100 = 78.94\% \cr & \text{Year 2008} = \frac{180}{240} × 100 = 75\% \cr} $$