
ExamVeda
Login
Home
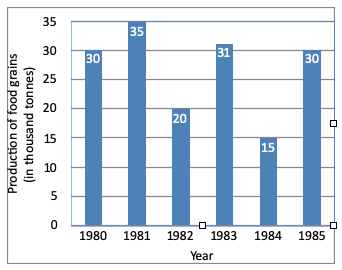
Directions (1 - 4): The graph shows the production of food grains of a country in different. Study the graph and answer the questions.
Direction image of Bar Chart chapter
1
The two consecutive years in which rate of change of production of food grains is minimum are.
Discuss
Answer & Solution
From graph it is clear two consecutive years in which rate of change is minimum are 1980 and 1981.
2
The difference of the production of food grains for the year 1981 and 1985 is:
Discuss
Answer & Solution
Difference of production of 1981 and 1985
= 35 - 30
= 5 × 1000
= 5000 tonnes
3
The percentage increase in production from 1984 to 1985 was.
Discuss
Answer & Solution
$$\eqalign{ & \text{% increase} \cr & = \frac{30 - 15}{15} \times 100 \cr & = \frac{15}{15} \times 100 \cr & = 100\% \cr} $$
4
The sum of the production of food grains in the year 1982 and 1984 is equal to that in the year:
Discuss
Answer & Solution
From the graph:
Sum of 1982 and 1984
= 20 + 15
= 35
Which is equal to the production of 1981