
ExamVeda
Login
Home
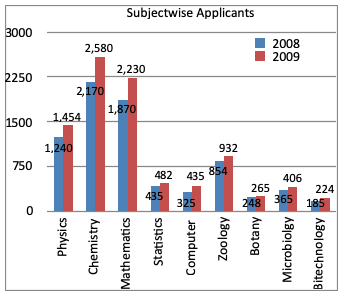
Directions (1 - 5): The subject wise number of applicants for the year 2008 and 2009 in a college is given in the following chart. study the graph and answer the questions.
Direction image of Bar Chart chapter
1
The number of physics seeking applicants increase by:
Discuss
Answer & Solution
$$\eqalign{ & \text{Required percentage increase} \cr & = \frac{1454 - 1240}{1240} \times 100 \cr & = \frac{214}{1240} \times 100 \cr & = 17.258\% \cr & = 17.26\% \cr} $$
2
The subject for which demand is maximum:
Discuss
Answer & Solution
Maximum demand is Chemistry subject.
3
The number of Mathematics seeking applicants increased by:
Discuss
Answer & Solution
$$\eqalign{ & \text{Required percentage increase} \cr & = \frac{2230 - 1870}{1870} \times 100 \cr & = \frac{360}{1870} \times 100 \cr & = 19.25\% \cr} $$
4
The number of Chemistry seeking applicants increased by:
Discuss
Answer & Solution
$$\eqalign{ & \text{Required percentage increase} \cr & = \frac{2580 - 2170}{2170} \times 100 \cr & = \frac{410}{2170} \times 100 \cr & = 18.89\% \cr} $$
5
The subject for which demand is minimum:
Discuss
Answer & Solution
Minimum demand is Botany subject.