
1
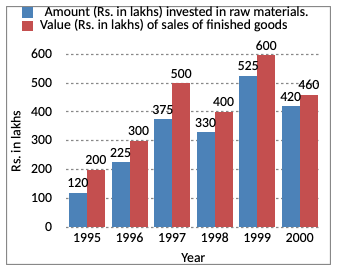
What was the difference between the average amount invested in raw materials during the given period and the average value of sales of finished goods during this period?
Answer & Solution
Average of total investment
$$= \frac{1}{6}$$ (120 + 225 + 375 + 330 + 525 + 420)
$$\eqalign{ & = \frac{1}{6} \times 1995 \cr & = {\text{Rs. }}332.5{\text{ lakhs}} \cr & \text{Average of sales} \cr}$$
$$= \frac{{200 + 300 + 500 + 400 + 600 + 460}}{6}$$
$$\eqalign{ & = \frac{{2460}}{6} \cr & = {\text{Rs. }}410 \cr & {\text{Difference}} = 410 - 332.5 \cr &\,\,\,\,\,\,\,\,\,\,\,\,\,\,\,\,\,\,\,\,\,\,\,\,\,\,\,\, = 77.5{\text{ lakhs}} \cr} $$
$$= \frac{1}{6}$$ (120 + 225 + 375 + 330 + 525 + 420)
$$\eqalign{ & = \frac{1}{6} \times 1995 \cr & = {\text{Rs. }}332.5{\text{ lakhs}} \cr & \text{Average of sales} \cr}$$
$$= \frac{{200 + 300 + 500 + 400 + 600 + 460}}{6}$$
$$\eqalign{ & = \frac{{2460}}{6} \cr & = {\text{Rs. }}410 \cr & {\text{Difference}} = 410 - 332.5 \cr &\,\,\,\,\,\,\,\,\,\,\,\,\,\,\,\,\,\,\,\,\,\,\,\,\,\,\,\, = 77.5{\text{ lakhs}} \cr} $$